Environmental Footprint is an excellent topic that aligns perfectly with the principles of data-driven improvement that Six Sigma Labs would champion.
Here is a comprehensive breakdown of the Environmental Footprint from a Six Sigma Labs perspective, focusing on measurement, analysis, and systematic reduction.
Environmental Footprint: A Six Sigma Labs Analysis
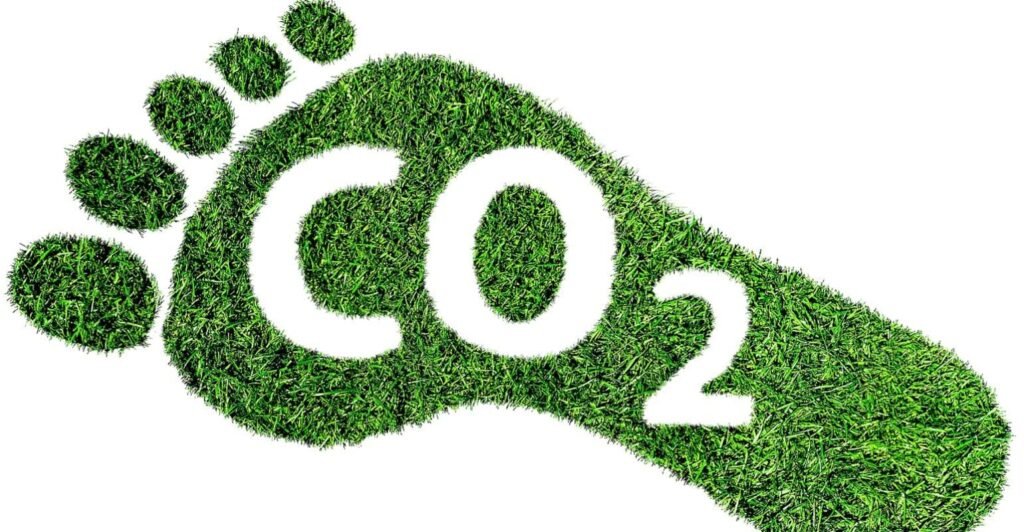
The Environmental Footprint is a measure of human demand on nature. It quantifies the amount of natural resources consumed and waste generated by an individual, organization, product, or nation, and compares it to the planet’s capacity to regenerate those resources and absorb waste.
For Six Sigma Labs, we view the Environmental Footprint not as a vague concept, but as a key performance indicator (KPI) that can be measured, analyzed, improved, and controlled using data-driven methodologies like DMAIC and Lean.
The Four Core Components (The “Big Four” Metrics)
We typically break down the total footprint into manageable, measurable components:
- Carbon Footprint (Greenhouse Gas Emissions):
- What it is: The total amount of carbon dioxide (CO₂) and other greenhouse gases emitted directly and indirectly by activities.
- Sources: Energy consumption (electricity, heating), transportation (fuel combustion), industrial processes, and supply chain activities.
- Measurement: CO₂ equivalents (CO₂e) in tonnes.
- Water Footprint:
- What it is: The total volume of freshwater used, directly and indirectly.
- Sources: Direct consumption, water used in manufacturing/agriculture, and “virtual water” embedded in products (e.g., water to grow cotton for a t-shirt).
- Measurement: Cubic meters or liters.
- Land Footprint (Ecological Footprint):
- What it is: The amount of biologically productive land and water area required to produce the resources consumed and to absorb the waste generated.
- Sources: Agriculture, forestry, urban infrastructure.
- Measurement: Global hectares (gha).
- Material/Waste Footprint:
- What it is: The total amount of raw materials extracted and the solid waste generated (to landfill, recycling, or incineration).
- Sources: Manufacturing scrap, packaging, end-of-life products, electronic waste.
- Measurement: Tonnes of waste or materials.
The Six Sigma Labs Framework: Applying DMAIC to Reduce Footprint
We can systematically reduce an organization’s environmental footprint using the DMAIC cycle (Define, Measure, Analyze, Improve, Control).
1. DEFINE
- Goal: Clearly define the project scope and goals related to the environmental footprint.
- Key Activities:
- Project Charter: Create a charter focusing on a specific footprint (e.g., “Reduce carbon footprint of Product X by 15% in 18 months”).
- Voice of the Customer (VOC): Understand stakeholder demands (regulators, customers, investors) for sustainability.
- SIPOC Map: Create a high-level Suppliers-Inputs-Process-Outputs-Customers map to understand the system boundaries. This is crucial for identifying scope 1, 2, and 3 emissions.
2. MEASURE
- Goal: Quantify the current state of the environmental footprint with reliable data.
- Key Activities:
- Data Collection Plan: Identify data sources for energy bills, fuel consumption, water usage, waste manifests, and supply chain data.
- Baseline Establishment: Calculate the current Carbon Footprint, Water Footprint, etc. This often involves using established standards like the Greenhouse Gas (GHG) Protocol.
- Key Metrics: Establish specific metrics like Energy Intensity (kWh per unit produced), Water Efficiency (liters per unit), and Waste Diversion Rate (% recycled vs. landfilled).
3. ANALYZE
- Goal: Identify the root causes of the largest environmental impacts.
- Key Activities:
- Pareto Analysis: Find the “vital few” processes or activities that contribute to 80% of the footprint (e.g., one manufacturing line is the largest energy consumer).
- Value Stream Mapping (Lean Tool): Map the process flow and identify non-value-added steps that generate excessive waste or energy use (e.g., unnecessary transportation, over-production).
- Root Cause Analysis (5 Whys, Fishbone Diagram): Drill down to find the fundamental reasons for inefficiency. Why is the compressor using so much energy? → Because it runs constantly. → Why? → Because there are air leaks in the system.
- Life Cycle Assessment (LCA): A powerful analytical tool to assess the total environmental impact of a product from “cradle to grave” (raw material extraction to disposal).
4. IMPROVE
- Goal: Implement and validate solutions to reduce the footprint.
- Key Activities:
- Generate Solutions: Brainstorm improvements (e.g., switch to LED lighting, install solar panels, optimize logistics routes, reduce packaging material, fix leaks).
- Pilot Testing: Run a small-scale pilot to test the effectiveness of a solution.
- Implementation: Roll out the successful solutions. Examples include:
- Energy: Equipment upgrades, process optimization, renewable energy.
- Water: Recycling greywater, installing low-flow fixtures.
- Waste: Implementing a circular economy model (reuse, remanufacture), finding recycling partners.
5. CONTROL
- Goal: Sustain the gains and maintain the new, lower footprint.
- Key Activities:
- Control Plan: Create a plan to monitor the key footprint metrics.
- Standard Operating Procedures (SOPs): Update SOPs to include the new, more efficient practices.
- Statistical Process Control (SPC): Use control charts to monitor energy consumption or waste generation and detect deviations early.
- Dashboarding: Create a sustainability dashboard for leadership to track performance.
The Business Case for Six Sigma Labs’ Approach
Reducing your environmental footprint is not just “green” — it’s a strategic business imperative.
- Cost Reduction: Lower energy, water, and raw material bills directly improve the bottom line.
- Risk Mitigation: Compliance with environmental regulations and reduced exposure to resource price volatility.
- Competitive Advantage: Meeting customer demand for sustainable products and qualifying for “green” tenders.
- Brand Enhancement & Reputation: Strengthening brand image and attracting top talent who want to work for responsible companies.
- Innovation Driver: The constraint of “reducing footprint” often forces innovative thinking and process redesign.
Conclusion
For Six Sigma Labs, the environmental footprint is a suite of quantifiable, manageable processes. By applying rigorous, data-driven methodologies like DMAIC, organizations can move beyond symbolic gestures and achieve significant, verifiable, and sustainable reductions in their environmental impact, turning a ecological responsibility into a competitive advantage.
What is Required Environmental Footprint
From a Six Sigma Labs perspective, the “Required Environmental Footprint” is a strategic, data-driven target for the maximum allowable environmental impact an organization can have to meet its compliance obligations, stakeholder expectations, and long-term business goals. It is the “specification limit” for sustainability performance.
It is not what your footprint is, but what it must be to ensure viability and success.
Defining the “Required Environmental Footprint”
Think of it as the Upper Specification Limit (USL) for your environmental impact. Any footprint that exceeds this “Required” level represents a defect in your operational and strategic planning, posing significant risk.
The Required Environmental Footprint is derived from a combination of hard constraints and strategic objectives.
1. Regulatory & Compliance Requirements (The “Hard Specs”)
This is the non-negotiable baseline. Your footprint must, at a minimum, be below the levels set by law.
- Examples:
- Carbon: Mandated emissions caps under a cap-and-trade system.
- Waste: Landfill bans on specific materials, required recycling rates.
- Water: Permitted limits on water extraction or effluent discharge.
- Air: Maximum allowable levels for pollutant emissions.
- Six Sigma Labs View: Failure to meet these requirements results in fines, shutdowns, and legal action. This is a Critical-to-Compliance (CTC) characteristic.
2. Market & Customer Requirements (The “Voice of the Customer”)
Your footprint must be low enough to meet the demands of your customers and supply chains.
- Examples:
- A major customer (e.g., Walmart, Apple) requires all suppliers to disclose and reduce their carbon footprint by a certain percentage.
- A government tender requires products to have an Environmental Product Declaration (EPD).
- Consumers increasingly choose products with eco-labels or lower embedded carbon.
- Six Sigma Labs View: Failure to meet these requirements means losing contracts and market share. This is a Critical-to-Quality (CTQ) characteristic.
3. Investor & Financial Requirements (The “Voice of the Business”)
Your footprint must align with the risk and performance expectations of investors and financial institutions.
- Examples:
- ESG (Environmental, Social, Governance) fund managers require specific sustainability performance.
- Banks offer lower interest rates for “green loans” tied to sustainability performance.
- Insurance premiums are linked to climate risk exposure.
- Six Sigma Labs View: A high footprint is seen as a financial and reputational risk. The “Required” level is one that minimizes this risk and maximizes access to capital.
4. Science-Based & Context-Based Targets (The “Strategic Specs”)
This is the most forward-thinking dimension. Your footprint must be in line with what science deems necessary to stay within planetary boundaries.
- Examples:
- Science-Based Targets (SBTi): Setting a carbon reduction target that aligns with keeping global warming to 1.5°C above pre-industrial levels.
- Water Neutrality: Returning as much water to the local watershed as you withdraw, to be sustainable in a water-stressed region.
- Zero Waste to Landfill: A target driven by the circular economy principle, not just by current law.
- Six Sigma Labs View: This sets a long-term, strategic USL that future-proofs the business and positions it as a leader.
The Six Sigma Labs Methodology: Defining the “Required” Spec
You don’t just guess the Required Environmental Footprint. You derive it systematically.
The DMAIC Approach for Defining the Requirement:
- DEFINE:
- Project Charter: “To define the Required Environmental Footprint for our Scope 1 & 2 Carbon Emissions for the next 5 years.”
- Stakeholder Analysis: Identify all voices: Regulatory bodies, key customers, investors, internal leadership, and scientific frameworks (SBTi).
- MEASURE:
- Benchmarking: Collect data on competitor footprints, industry best practices, and regulatory thresholds.
- Stakeholder Surveys: Formally capture requirements from customers and investors.
- Gap Analysis: Compare your current footprint against potential future requirements.
- ANALYZE:
- Constraint Analysis: Determine which requirement is the most stringent. Is it the new regulation in 2025, or the customer demand in 2024?
- Risk Assessment: Quantify the risk (Severity x Occurrence) of failing to meet each potential requirement.
- Pareto Analysis: Often, 20% of the requirements (e.g., one major customer and one new law) will drive 80% of the “Required” spec.
- IMPROVE & CONTROL:
- Set the Target: Synthesize the analysis into a single, quantifiable target. “The Required Carbon Footprint is a 35% reduction in absolute Scope 1 & 2 emissions by 2027, from a 2022 baseline.”
- Communicate: This target becomes a key business KPI, integrated into strategic plans and performance scorecards.
- Monitor: Track progress against this “Required” spec just as you would track any other critical business metric.
Practical Example: Acme Manufacturing
- Current Footprint: 10,000 tonnes CO2e/year.
- Analysis of Requirements:
- Regulatory: New law in 2026 caps emissions at 8,000 tonnes.
- Customer: Top client requires a 20% reduction by 2025 for all partners.
- Science-Based: SBTi calculation shows a required 40% reduction by 2030.
- Six Sigma Labs Conclusion:
The most immediate and stringent requirement is the customer’s 20% reduction by 2025. Therefore, the Required Environmental Footprint for 2025 is 8,000 tonnes CO2e/year. The law in 2026 reinforces this, and the SBTi target sets the long-term trajectory beyond 2025.
Conclusion
For Six Sigma Labs, the Required Environmental Footprint is a precise, data-backed specification. It is the culmination of a rigorous analysis of external constraints and strategic ambitions. By defining this “Required” state, an organization transforms sustainability from a vague aspiration into a concrete, manageable, and critical business goal, enabling a focused DMAIC project to close the gap between the current and required state.
Who is Required Environmental Footprint

The “Required Environmental Footprint” is set by a combination of external and internal stakeholders. From a Six Sigma Labs perspective, we identify the “Voice of the Customer” for this requirement.
Here are the key entities that require a specific environmental footprint:
1. Regulatory Bodies & Governments (The Enforcers)
- Who they are: The Environmental Protection Agency (EPA), European Union, local environmental ministries.
- What they require: They set legal limits on pollution, waste disposal, carbon emissions, and water usage. Your footprint must be below these legal thresholds.
- Six Sigma Labs Term: Critical-to-Compliance (CTC) Requirement.
2. Customers & Supply Chains (The Market)
- Who they are: Major corporations (e.g., Walmart, Apple, Ford), consumers, business-to-business clients.
- What they require: They increasingly demand sustainable products and practices. They may require you to disclose your carbon footprint, use less packaging, or meet specific eco-certifications to remain a supplier.
- Six Sigma Labs Term: Critical-to-Quality (CTQ) Requirement.
3. Investors & Financial Institutions (The Bankrollers)
- Who they are: ESG (Environmental, Social, Governance) funds, banks, insurance companies, shareholders.
- What they require: They see a large environmental footprint as a financial risk. They may require footprint reduction targets to secure investment or favorable loan rates.
- Six Sigma Labs Term: Critical-to-Business (CTB) Requirement.
4. Internal Leadership & Strategy (The Strategists)
- Who they are: The CEO, Board of Directors, and internal sustainability teams.
- What they require: They set voluntary, strategic targets to future-proof the business, reduce costs (e.g., energy efficiency), and enhance brand reputation. They might adopt frameworks like Science-Based Targets (SBTi).
- Six Sigma Labs Term: Strategic Specification.
5. The Scientific Community & Planetary Boundaries (The Ultimate Reality Check)
- Who they are: The IPCC (Intergovernmental Panel on Climate Change), climate scientists, and global agreements like the Paris Accord.
- What they require: They define the physical limits of what the planet can handle. While not a direct legal requirement, they provide the scientific basis for what a truly sustainable footprint must be in the long term.
- Six Sigma Labs Term: The Ultimate Upper Specification Limit (USL).
Summary
To put it simply:
| If you ask: “Who is the Required Environmental Footprint?” |
|---|
| Answer: It is not a person. It is a target specification for environmental performance. |
| If you ask: “Who requires a specific Environmental Footprint?” |
|---|
| Answer: A group of stakeholders including Governments, Customers, Investors, Company Leadership, and Scientific Reality. |
When is Required Environmental Footprint
From a Six Sigma Labs perspective, the “When” of the Required Environmental Footprint is not a single point in time. It is a time-bound compliance deadline, a strategic milestone, and a continuous performance standard all at once.
It defines the schedule for action and the consequences of missing deadlines.
The “When” is Defined by Triggers and Deadlines
The Required Environmental Footprint becomes critically relevant at several key moments:
1. During Strategic Planning & Goal Setting (The Proactive “When”)
- When it happens: Annually, during quarterly business reviews (QBRs), or at the inception of a new long-term strategy (e.g., a 5-year plan).
- Six Sigma Labs Context: This is when leadership uses tools like Hoshin Kanri (Policy Deployment) to cascade high-level sustainability goals down to departmental objectives. The “Required” footprint is defined now to guide action later.
- Example: “As of Q1 2024, our required footprint for 2030 is a 50% reduction in emissions. Therefore, we must launch Project A in 2024 to be on track.”
2. At the Point of Regulatory Enforcement (The Mandatory “When”)
- When it happens: On the specific date a new law or regulation comes into effect.
- Six Sigma Labs Context: This is a hard control point. Failure to meet the requirement by this date results in a “defect” (e.g., a fine, permit revocation, or operational shutdown).
- Example: “The new carbon tax law takes effect January 1, 2026. Our required footprint on that day must be below 10,000 tonnes CO2e to avoid financial penalty.”
3. In Response to Customer & Contractual Obligations (The Contractual “When”)
- When it happens: At the start of a new contract, during a supplier re-qualification audit, or by a date specified by a major client.
- Six Sigma Labs Context: This is a Critical-to-Quality (CTQ) delivery date. Missing this date means failing a customer audit and potentially losing business.
- Example: *”Our largest customer, AutoCorp, requires all Tier-1 suppliers to achieve a 20% reduction in water footprint by the end of FY2025 to remain on their approved vendor list.”*
4. When Accessing Capital or Financing (The Financial “When”)
- When it happens: At the time of a loan application, a investor ESG audit, or when reporting to a board for capital allocation.
- Six Sigma Labs Context: This is a gate review. The company must demonstrate it meets the required footprint at the time of the review to unlock funding.
- Example: “To qualify for the ‘Green Bond’ offering in Q3 2024, we must prove our corporate carbon footprint is below the threshold defined in the bond’s framework.”
5. At the Moment of Market or Reputational Risk (The Reactive “When”)
- When it happens: During a public relations crisis, following a competitor’s breakthrough announcement, or after a negative sustainability report is published.
- Six Sigma Labs Context: This is a reactive correction. The “required” footprint suddenly becomes more stringent to mitigate reputational damage and is effective immediately.
- *Example: “After our competitor announced a ‘Net Zero by 2030’ goal last week, our board has now redefined our required footprint to match it, effective immediately.”
The Six Sigma Labs Framework: Timing the DMAIC Cycle
The “When” dictates the urgency and schedule of your improvement projects.
- DEFINE (When to Scope): You must define the project as soon as the requirement is established and a gap is identified. If the deadline is 3 years away, you start now.
- MEASURE & ANALYZE (When to Diagnose): This phase must be completed well before the deadline to allow time for effective solutions. A long analysis phase for a short deadline demands a different approach.
- IMPROVE (When to Implement): Solutions must be piloted and implemented with enough time to validate results before the compliance date.
- CONTROL (When to Sustain): The control plan must be active from the moment the improved process goes live and must persist indefinitely to ensure the new, lower footprint is maintained.
Practical Scenarios: The “When” in Action
| Scenario | The “When” of the Required Footprint | Six Sigma Labs Implication |
|---|---|---|
| New Carbon Tax | Law enacted January 1, 2027 | A DMAIC project to reduce energy intensity must be completed by Q4 2026 to avoid the tax. |
| Major Client Demand | Supplier audit scheduled for June 30, 2025 | A focused Kaizen event on waste reduction must be held in Q1 2025 to ensure data is ready for the audit. |
| Science-Based Target | 50% reduction by 2030 from a 2022 baseline | A multi-phase DMAIC project must be launched in 2024, with milestone targets (e.g., 10% by 2025) to ensure on-time completion. |
| Investor ESG Fund | Annual reporting deadline is March 31st | Data collection and control charts for the footprint must be updated quarterly to be ready for the annual report. |
Conclusion
For Six Sigma Labs, the question “When is the Required Environmental Footprint?” is answered with: “It is right now, and at every future deadline.”
- Right Now: Because the current performance gap defines the urgency and scale of the project needed.
- At Every Future Deadline: Because each regulatory, customer, and strategic milestone creates a non-negotiable control point where performance must conform to specification.
Understanding the “When” is essential for proper project planning, resource allocation, and risk management, ensuring that the organization is not just moving in the right direction, but moving at the right pace to meet its obligations.
Where is Required Environmental Footprint
The “Where” is Defined by System Boundaries
The Required Environmental Footprint exists within specific, defined scopes. The most recognized framework for this, especially for carbon, is the Greenhouse Gas (GHG) Protocol, which provides a perfect model for understanding “where.”
1. Organizational Boundary: Where is the Requirement Held?
This defines which parts of the organization are accountable.
- The “Where”: It is at the corporate level, the facility level, the product line, or even the specific project level.
- Six Sigma Labs Context: This is like defining your “process owner.” The requirement is assigned to the entity that has control or ownership.
- Example: The “Required Carbon Footprint” might be a corporate-wide target set by the CEO, but it is deployed where the emissions occur: to the Manufacturing VP, the Logistics Director, and the Facility Managers.
2. Operational Boundary (The Three Scopes): Where are the Impacts Generated?
This is the most critical “where.” It categorizes all sources of the footprint into three areas.
Scope 1: Direct Emissions (The “Inside the Fence” Where)
- Where it is: On-site, at facilities you own or control.
- Sources:
- Boilers, furnaces, company-owned vehicles.
- Chemical production in your owned equipment.
- Fugitive emissions (e.g., leaks from AC units).
- Six Sigma Labs View: This is your direct process output. You have the highest degree of control here.
Scope 2: Indirect Emissions from Purchased Energy (The “Utility Meter” Where)
- Where it is: At the power plant that generates your electricity, steam, heating, and cooling.
- Sources: Emissions from burning coal or gas to create the electricity you purchase and use.
- Six Sigma Labs View: This is a key input to your process. You can influence this by choosing green energy tariffs or generating your own renewable energy on-site.
Scope 3: Other Indirect Emissions (The “Value Chain” Where)
- Where it is: Everywhere else in your value chain, both upstream and downstream.
- Upstream Sources:
- Purchased goods & services: Where your raw materials are extracted and manufactured.
- Capital goods: Where your machinery and equipment are made.
- Transportation & distribution: Where your logistics partners operate.
- Business travel: Where your employees fly and drive.
- Downstream Sources:
- Use of sold products: Where your customers use your product (e.g., the fuel burned by a car you sold).
- End-of-life treatment: Where your product is disposed of or recycled.
- Six Sigma Labs View: This is the entire Supplier-Input-Process-Output-Customer (SIPOC) map. It is the largest and most complex “where,” often representing 80%+ of a company’s total footprint.
The Six Sigma Labs Methodology: Mapping the “Where”
To manage the Required Environmental Footprint, you must first map where it comes from.
- Create a SIPOC Map for Your Value Chain:
- Suppliers: Where do your raw materials come from?
- Inputs: Where is the energy and water sourced?
- Process: Where in your manufacturing/operations are wastes and emissions generated?
- Outputs: Where do your products go?
- Customers: Where and how are your products used and disposed of?
- Apply a Physical “Where” Checklist:
The Required Footprint applies…- At your corporate headquarters (energy use, travel).
- At every manufacturing plant and warehouse (energy, waste, direct emissions).
- In your vehicle fleet (fuel combustion).
- At your suppliers’ locations (embedded carbon in materials).
- In transit (on ships, planes, trucks moving your goods).
- At your customers’ locations (energy to use your product).
- In landfills and recycling centers (end-of-life of your products).
Practical Example: A Car Manufacturer’s “Where”
- Required Footprint: Reduce total carbon footprint by 30% by 2030.
- Where is this requirement applied?
- Scope 1 (Inside our factories): Paint shop emissions, natural gas for heating, test track vehicle fuel.
- Scope 2 (Our energy supply): The coal-fired power plant supplying our Ohio factory.
- Scope 3 (Our value chain):
- Upstream: The steel mill in Korea, the tire factory in Vietnam, the microchip fab in Taiwan.
- Downstream: The gasoline burned in millions of cars on the road, the scrap yard where cars are crushed.
Conclusion
For Six Sigma Labs, the question “Where is the Required Environmental Footprint?” is answered with: “It is everywhere your value chain touches.”
- It is inside your direct operations (Scope 1 & 2), where you have the most control.
- It is embedded in your supply chain (Upstream Scope 3), where you have significant influence.
- It is in the hands of your customers (Downstream Scope 3), where you have a responsibility for design and innovation.
Identifying the “where” is the essential first step to prioritizing efforts. You must use tools like Pareto analysis to find the “vital few” locations in your value chain that contribute the most to your footprint, and then focus your DMAIC projects there. You cannot manage what you cannot locate.
How is Required Environmental Footprint
1. How to DEFINE the Required Environmental Footprint
This is a strategic and analytical process.
- How: Through Stakeholder Analysis and Benchmarking
- Gather the ‘Voice of the Customer’: Conduct formal surveys and interviews with regulators, major clients, and investors to understand their specific requirements and deadlines.
- Benchmark Against Peers & Science: Use tools like competitive analysis and the Science-Based Targets initiative (SBTi) to define a target that is both ambitious and credible.
- Perform a Gap Analysis: Calculate your current footprint and compare it against all the potential future requirements. The most stringent requirement defines the target.
- Use the GHG Protocol Corporate Standard: This is the definitive “how-to” guide for calculating and defining your organizational footprint boundaries (Scopes 1, 2, and 3).
Output: A clear, quantifiable, and time-bound statement. E.g., “Required Footprint: 50% reduction in absolute Scope 1 & 2 emissions by 2030 from a 2020 baseline.”
2. How to ACHIEVE the Required Environmental Footprint
This is the core improvement work, driven by the DMAIC cycle.
- How: By Executing a DMAIC Project
- D (Define):
- How: Create a project charter with a clear business case. Use a SIPOC diagram to map the high-level value chain and identify where the biggest impacts (and opportunities) are located.
- M (Measure):
- How: Establish a robust data collection plan. Use Energy Management Systems (EMS), utility bills, waste manifests, and life cycle assessment (LCA) software to quantify the baseline. Calculate metrics like Energy Intensity (kWh per unit) or Carbon Intensity (CO2e per dollar of revenue).
- A (Analyze):
- How: Use data-driven tools to find the root causes of the excessive footprint.
- Pareto Chart: To identify the 20% of processes causing 80% of the impact.
- Value Stream Mapping: To identify non-value-added steps that generate waste or consume excess energy.
- 5 Whys / Fishbone Diagram: To drill down to the root cause of an inefficiency (e.g., Why is the compressor using so much energy? → Air leaks. → Why? → Lack of a preventive maintenance schedule.).
- How: Use data-driven tools to find the root causes of the excessive footprint.
- I (Improve):
- How: Generate, test, and implement solutions.
- Brainstorming & FMEA (Failure Mode and Effects Analysis): To evaluate potential solutions for effectiveness and risk.
- Pilot Studies: To test a solution on a small scale before a full rollout.
- Implementation: This could involve:
- Technology/Equipment: Installing LED lighting, solar panels, or more efficient motors.
- Process Optimization: Reducing material scrap, optimizing logistics routes to minimize fuel.
- Behavioral Change: Employee engagement campaigns to turn off lights and equipment.
- How: Generate, test, and implement solutions.
- D (Define):
3. How to SUSTAIN the Required Environmental Footprint
Achieving the target is pointless if you cannot maintain it.
- How: Through Robust Control Systems
- Control Plans: Document the new, efficient standard operating procedures (SOPs).
- Statistical Process Control (SPC): Use control charts to monitor key energy or waste metrics. If the data shows a trend toward the old, inefficient performance, you can intervene immediately—before the footprint spec is violated.
- Sustainability Dashboards: Create real-time visual management tools that track performance against the “Required” target, making the footprint visible to everyone.
- Integrate into Management Systems: Embed the footprint KPIs into regular business reviews, performance scorecards, and ISO 14001 (Environmental Management) audits.
The Enablers: “How” You Support the Entire Effort
- How with Technology: Use IoT sensors, AI-powered energy management platforms, and LCA software to gather data and provide insights.
- How with People: Establish a Green Belt/Black Belt project team with cross-functional membership (Engineering, Operations, Supply Chain, Finance).
- How with Finance: Develop a strong business case focusing on Total Cost of Ownership (TCO), not just upfront cost, to justify investments in green technology.
Practical Example: “How” in Action
Scenario: Required Footprint is a 25% reduction in water use at a factory.
- HOW to Define: Analysis shows the local aquifer is stressed (regulatory risk) and a key customer has a new water stewardship policy.
- HOW to Achieve:
- Measure: Install water meters on major equipment to establish a baseline.
- Analyze: A Pareto chart reveals the cooling towers and rinse process are the largest users. A 5-Why analysis finds the rinse process runs longer than necessary because of an outdated timer.
- Improve: The team installs a new automated timer and implements a closed-loop system for the cooling towers.
- HOW to Sustain:
- The new timer settings are documented in an SOP.
- A control chart monitors daily water usage, with action triggers if it exceeds control limits.
- Water usage is a standing agenda item in the monthly plant manager review.
Conclusion
For Six Sigma Labs, the “How” of the Required Environmental Footprint is the systematic application of data-driven problem-solving.
It is not about vague sustainability goals. It is about:
- Using DMAIC as the engine for reduction.
- Employing statistical tools for analysis and control.
- Leveraging technology for measurement.
- Relying on cross-functional teams for execution.
The “How” transforms the Required Environmental Footprint from a strategic target on a spreadsheet into an actively managed, continuously improved, and sustainably controlled business process.
Case Study on Environmental Footprint
Reducing the Carbon Footprint at “Precision Components Inc.”
A Six Sigma Labs DMAIC Project
Executive Summary
Precision Components Inc. (PCI), a mid-tier automotive parts supplier, faced mounting pressure from its largest customer, “AutoMotive Giant (AMG),” to reduce its carbon footprint. AMG mandated a 20% reduction in Scope 1 and 2 greenhouse gas (GHG) emissions within 24 months for all key suppliers. Failure to comply would risk losing a contract worth 30% of PCI’s annual revenue.
PCI engaged Six Sigma Labs to lead a structured project to not only meet but exceed this requirement, turning a compliance risk into a competitive advantage.
Phase 1: DEFINE
Goal: To clearly define the project scope, goal, and stakeholders based on the customer requirement.
- Business Case: The AMG contract is critical. Additionally, rising energy costs were eroding profit margins. Reducing energy consumption would address both issues simultaneously.
- Project Charter:
- Problem Statement: Our current Scope 1 & 2 carbon footprint is 5,000 tonnes CO2e annually. AMG requires a 20% reduction (to 4,000 tonnes CO2e) within 24 months, putting our flagship contract at risk.
- Goal Statement: Reduce absolute Scope 1 and 2 GHG emissions by 25% (to 3,750 tonnes CO2e) within 24 months, exceeding the customer requirement.
- Scope: Includes all energy use at the main manufacturing facility (Natural Gas, Grid Electricity, Company Fleet). Excludes upstream supply chain (Scope 3) for this project.
- Team: Green Belt (Project Lead), Plant Engineer, Maintenance Manager, Finance Analyst, Sustainability Officer.
- SIPOC Analysis (High-Level):
- Suppliers: Utility Companies, Natural Gas Provider
- Inputs: Grid Electricity, Natural Gas, Fleet Diesel
- Process: Manufacture of automotive components (Injection Molding, Metal Stamping, Assembly)
- Outputs: Finished Parts, GHG Emissions, Scrap Waste
- Customer: AutoMotive Giant (AMG)
Phase 2: MEASURE
Goal: To establish a accurate baseline and validate the measurement system for energy consumption and carbon emissions.
- Data Collection Plan:
- Collected 24 months of historical data from utility bills (electricity kWh, natural gas therms).
- Installed sub-meters on major equipment: Injection Molding Machines, Stamping Presses, HVAC System, and Compressed Air System.
- Gathered fleet fuel consumption records.
- Baseline Calculation:
- Using GHG Protocol conversion factors, the baseline was confirmed:
- Electricity: 4,200,000 kWh/year = ~2,100 tonnes CO2e
- Natural Gas: 45,000 therms/year = ~2,500 tonnes CO2e
- Fleet Diesel: 50,000 liters/year = ~135 tonnes CO2e
- TOTAL BASELINE: ~4,735 tonnes CO2e (The initial 5,000t estimate was refined).
- Using GHG Protocol conversion factors, the baseline was confirmed:
- Process Mapping: Created a detailed value stream map of the manufacturing process, identifying all major energy-consuming steps.
Phase 3: ANALYZE
Goal: To identify the root causes of the highest energy consumption and associated emissions.
- Pareto Analysis: The data revealed that the top 80% of energy consumption came from three areas:
- Compressed Air System (32%)
- Injection Molding Process (28%)
- HVAC for Climate Control (20%)
- Detailed Investigation & Root Cause Analysis:
- Compressed Air System:
- Data: The system ran at 110 PSI, but most equipment required only 90 PSI. Data loggers identified significant pressure drops and air leaks.
- Root Cause (5 Whys): Why high pressure? To compensate for leaks and pressure drops. Why leaks? No proactive leak detection and repair program.
- Injection Molding:
- Data: Older machines ran 24/7, even during 30-minute lunch breaks and 10-minute shift changes.
- Root Cause: No standard operating procedure for shutting down equipment during extended idle periods. Fear of damaging machines from frequent cycling.
- HVAC System:
- Data: The system maintained a constant temperature (21°C) 24/7, including weekends and nights when the plant was unoccupied.
- Root Cause: Outdated programmable thermostat with no optimized schedule. Lack of awareness about the energy cost.
- Compressed Air System:
Conclusion: The high carbon footprint was not due to a single cause but a combination of inefficient system design, lack of standardized procedures, and outdated controls.
Phase 4: IMPROVE
Goal: To implement and validate solutions that address the root causes.
- Solution Generation & Selection:
- Compressed Air System Overhaul:
- Solution: Implement a leak detection and repair program (weekly audits). Install a variable speed drive (VSD) compressor and lower the system pressure to 95 PSI.
- Pilot Result: On one production line, this reduced compressed air energy use by 18%.
- Injection Molding “Energy-Aware” SOPs:
- Solution: Created new SOPs that mandated switching machines to “low-power standby” during breaks >15 minutes. Provided training to alleviate fears.
- Pilot Result: Reduced machine energy consumption during non-production hours by 40%.
- HVAC Optimization:
- Solution: Upgraded to a smart building management system. Implemented a schedule: 21°C during work hours, 16°C during nights/weekends.
- Pilot Result: Reduced HVAC energy consumption by 25%.
- Compressed Air System Overhaul:
- Full Implementation:
- The solutions were rolled out plant-wide over 6 months.
- A 10% capital investment was approved for the VSD compressor and building management system, with a projected payback period of 2.5 years through energy savings.
Phase 5: CONTROL
Goal: To sustain the gains and maintain the new, lower carbon footprint.
- Control Plan:
- Updated SOPs: The new energy-aware procedures for molding machines and HVAC settings were documented and incorporated into regular operator training.
- Visual Management: A real-time energy dashboard was installed in the plant manager’s office, showing live energy consumption and carbon emissions against the target.
- Statistical Process Control (SPC):
- Control charts were used to monitor weekly natural gas and electricity consumption. Any point trending outside the control limits triggers an immediate investigation.
- Sustaining the Culture:
- Energy performance became a standing KPI in monthly management reviews.
- The success of the project was communicated company-wide, and a Green Belt program was established to tackle the water footprint next.
Results & Financial Impact (18 Months Post-Project Start)
| Metric | Baseline | Result | Improvement |
|---|---|---|---|
| Scope 1 & 2 Emissions | 4,735 t CO2e | 3,550 t CO2e | 25% Reduction (Goal Achieved) |
| Annual Energy Costs | $650,000 | $505,000 | $145,000 Annual Savings |
| Compressed Air Energy Use | 32% of total | 22% of total | 10% point reduction |
| AMG Contract Status | At Risk | Secured & Extended | Strategic Partner Status |
Conclusion
By applying the rigorous, data-driven Six Sigma DMAIC methodology, Precision Components Inc. transformed a mandated environmental footprint reduction from a compliance threat into a significant financial and strategic victory. The project not only exceeded the customer’s requirement but also boosted profitability through substantial energy savings, demonstrating that operational excellence and environmental stewardship are powerfully aligned.
White paper on Environmental Footprint
The era of voluntary sustainability is over. Organizations now face a complex landscape of regulatory mandates, investor scrutiny, and supply chain pressures demanding quantifiable reductions in their Environmental Footprint. Traditional, siloed approaches are insufficient. This white paper introduces a proven, systematic framework from Six Sigma Labs for treating your Environmental Footprint not as an abstract concept, but as a critical business process variable. By applying the disciplined, data-driven principles of DMAIC (Define, Measure, Analyze, Improve, Control), organizations can transform their environmental footprint from a compliance burden into a source of competitive advantage, operational efficiency, and resilient growth.
1. Introduction: The New Operational Imperative
An organization’s Environmental Footprint—the sum of its carbon emissions, water consumption, waste generation, and land use—has transcended its role as a mere corporate social responsibility (CSR) metric. It is now a definitive indicator of operational efficiency, risk exposure, and long-term viability.
Stakeholders, including regulators, investors, and customers, are no longer satisfied with promises. They require data-backed evidence of improvement. This paper argues that achieving these required reductions necessitates a methodology as rigorous as those used for quality and financial performance. The Six Sigma DMAIC framework provides that structure.
2. The Problem: Why Good Intentions Are Not Enough
Many organizations approach footprint reduction with ambition but lack a system for execution. Common failures include:
- Vague Goals: “Become more sustainable” instead of “Reduce Scope 1 GHG emissions by 30% by 2025.”
- Data Blindness: Inability to accurately measure the baseline or the impact of initiatives.
- Siloed Projects: Isolated “green” initiatives that fail to integrate into core operations.
- Lack of Sustained Control: Initial gains are lost over time as old habits and processes resurface.
These approaches waste resources and fail to meet the stringent “Required Environmental Footprint” now being imposed by external forces.
3. The Six Sigma Labs Solution: The DMAIC Framework for Environmental Footprint
Our methodology treats the Environmental Footprint as a process output to be managed and optimized.
Phase 1: DEFINE – Establishing the “Required” Spec
- Objective: Translate external pressures into a precise, project-specific goal.
- Key Tools & Outputs:
- Stakeholder Analysis: Identify the “Voice of the Customer” (regulators, clients, investors).
- Project Charter: A formal document stating the problem, business case, goal (e.g., “25% reduction in water intensity”), scope (e.g., Scope 1 & 2 emissions only), and team.
- SIPOC Map (Suppliers, Inputs, Process, Outputs, Customers): A high-level map to bound the system under study and identify key footprint sources.
Phase 2: MEASURE – Quantifying the Baseline
- Objective: Establish a reliable, data-based understanding of the current state.
- Key Tools & Outputs:
- Data Collection Plan: Identifying what data to collect (e.g., utility bills, waste manifests, travel records), where, and how.
- GHG Protocol Compliance: Correctly categorizing emissions into Scope 1 (direct), Scope 2 (indirect from purchased energy), and Scope 3 (value chain).
- Baseline Metrics: Calculating key performance indicators (KPIs) like Carbon Intensity (CO2e per unit produced) or Water Efficiency (liters per product).
Phase 3: ANALYZE – Identifying Root Causes of Impact
- Objective: Move beyond symptoms to find the fundamental processes driving the largest portions of the footprint.
- Key Tools & Outputs:
- Pareto Analysis: To separate the “vital few” footprint sources from the “trivial many.”
- Process Mapping & Value Stream Mapping: To visualize the flow of materials and energy, identifying non-value-added steps that generate waste.
- Root Cause Analysis (5 Whys, Fishbone Diagram): To drill down to the underlying reasons for inefficiency (e.g., Why is energy consumption high? → The compressor runs constantly. → Why? → Because of air leaks in the system.).
Phase 4: IMPROVE – Implementing and Validating Solutions
- Objective: Execute targeted solutions to eliminate root causes.
- Key Tools & Outputs:
- Solution Brainstorming & Selection Matrix: Evaluating potential solutions based on impact, cost, and feasibility.
- Pilot Studies: Testing solutions on a small scale to validate effectiveness and identify unintended consequences before full rollout.
- Implementation Plan: Examples of solutions include:
- Process Optimization: Reducing material scrap, optimizing logistics routes.
- Technology Upgrades: Installing LED lighting, high-efficiency motors, solar panels.
- Behavioral Changes: Employee engagement programs for energy conservation.
Phase 5: CONTROL – Sustaining the Gains
- Objective: Embed the new, lower footprint into the standard operating culture.
- Key Tools & Outputs:
- Control Plan: A living document outlining how to monitor the key footprint metrics.
- Standard Operating Procedures (SOPs): Updating work instructions to include the new, efficient practices.
- Statistical Process Control (SPC): Using control charts to monitor energy or waste data and detect deviations from the new performance standard.
- Sustainability Dashboard: Providing real-time visibility of footprint KPIs to management.
4. Case in Point: Precision Components Inc.
A brief illustration (as detailed in the accompanying case study) demonstrates the framework’s power:
- Challenge: A mandate from a key automaker to reduce carbon emissions by 20% in 24 months.
- DMAIC Application:
- Define & Measure: Established a baseline of 4,735 tCO2e and pinpointed the compressed air system (32%) as the largest source.
- Analyze: Root cause analysis identified air leaks and an inefficient operating pressure.
- Improve: Implemented a leak detection program and installed a variable-speed-drive compressor.
- Control: Updated maintenance SOPs and implemented a real-time energy dashboard.
- Result: 25% reduction in emissions (exceeding the goal) and $145,000 in annual energy savings.
5. The Business Case: Beyond Compliance
Adopting this framework delivers tangible financial and strategic returns:
- Cost Reduction: Direct savings from lowered energy, water, and material consumption.
- Risk Mitigation: Proactive compliance with current and future regulations; reduced exposure to resource price volatility.
- Enhanced Brand Value & Customer Loyalty: Meeting the market demand for verifiable sustainability.
- Innovation & Competitive Advantage: The constraint of footprint reduction drives process re-engineering and operational excellence.
6. Conclusion and Call to Action
In the 21st century, a company’s environmental performance is inseparable from its business performance. The “Required Environmental Footprint” is a fixed feature of the corporate landscape. The choice for leadership is not if to reduce their footprint, but how.
The Six Sigma Labs DMAIC framework provides the “how.” It offers a disciplined, proven pathway to:
- Define what is required.
- Measure what is real.
- Analyze what is causal.
- Improve what is possible.
- Control what is achieved.
Organizations that embrace this data-driven approach will not only meet their sustainability obligations but will also uncover new efficiencies, build more resilient operations, and secure a definitive competitive edge.
Begin your journey today. Start by mapping your highest-impact processes and measuring your baseline. The data you collect will be the foundation of your success.
Industrial Application of Environmental Footprint
In an industrial context, the Environmental Footprint is a direct measure of resource inefficiency. Every ton of CO2 emitted, every cubic meter of water wasted, and every kilogram of material sent to landfill represents a purchased input that was not converted into saleable product. Applying the Six Sigma Labs methodology systematically attacks these inefficiencies at their source.
Core Philosophy:
Environmental Footprint = Cost Footprint
Reducing one directly reduces the other.
Sector-Specific Applications & Examples
The following table outlines how the DMAIC framework is applied to high-impact areas across different industrial sectors.
| Industry | Key Environmental Footprint | Six Sigma Labs DMAIC Application | Tangible Outcome |
|---|---|---|---|
| Heavy Manufacturing (e.g., Steel, Automotive) | Carbon (Energy Intensity), Waste (Scrap Metal/Slag) | – D/M: Baselining energy per ton of steel. – A: Pareto analysis reveals reheating furnaces as top energy user. Root cause: poor insulation and suboptimal firing cycles. – I: Install advanced refractories, implement AI-driven combustion control. – C: SPC control charts on furnace fuel consumption. | 20% reduction in natural gas consumption, leading to lower costs and lower CO2 footprint. |
| Food & Beverage Processing | Water Footprint, Organic Waste (BOD/COD) | – D/M: Mapping and measuring water use at each process step (cleaning, cooking, cooling). – A: Cause & Effect diagram finds root causes: inefficient nozzles, single-pass cooling, no water recycling. – I: Install high-pressure/low-volume sprayers, implement closed-loop cooling systems. – C: Daily water balancing and meter monitoring against established control limits. | 30-50% reduction in water intake and effluent treatment costs. |
| Chemicals & Pharmaceuticals | Carbon, Material Loss (Solvents, Raw Materials), Hazardous Waste | – D/M: Conducting a Material Balance (Mass Balance) to track all inputs and outputs. – A: Identifying “loss points” in distillation, filtration, and cleaning processes. – I: Optimize batch recipes to minimize solvent use, implement solvent recovery systems. – C: Strict SOPs for material handling; regular audits of mass balance closures. | Reduced raw material costs, minimized hazardous waste disposal liabilities. |
| Microelectronics & Semiconductors | PFC Emissions (Powerful GHGs), High Water Purity (Ultrapure Water – UPW), High Energy for Cleanrooms | – D/M: Precise tracking of PFC gas usage in etching/cleaning chambers. – A: Using FMEA to identify process steps with low utilization efficiency of gases. – I: Redesigning process chambers or installing abatement systems to destroy PFCs before release. Optimizing UPW system regeneration cycles. – C: Real-time emissions monitoring with automated shut-off controls. | Near-elimination of PFC emissions (meeting regulatory mandates), 15% reduction in UPW generation energy. |
| Textiles & Apparel | Water (Dyeing), Chemicals (Dyes, Fixers), Energy (Thermal Energy for Drying) | – D/M: Measuring water, chemical, and energy consumption per kg of fabric. – A: Analyzing dye bath exhaustion rates; finding root cause of re-dyeing (defects). – I: Shift to super-critical CO2 dyeing (uses no water), optimize dye bath chemistry. – C: Standardized dye formulas and process parameters with quality gates to prevent re-work. | Dramatic reduction in toxic effluent, 40% energy savings from eliminating hot water drying. |
Cross-Functional Industrial Tools & Technologies
The application of this methodology is enabled by specific industrial-grade tools:
- Energy Management Systems (EnMS) like ISO 50001: Provides the framework for the continuous “Measure and Control” cycle, directly aligning with DMAIC.
- Manufacturing Execution Systems (MES) & IoT Sensors: Provide real-time, granular data on energy, water, and material consumption at the machine level—the essential fuel for the Measure and Analyze phases.
- Life Cycle Assessment (LCA) Software: Used extensively in the Analyze phase to understand the total “cradle-to-gate” footprint of a product, helping prioritize which raw materials or processes to target.
- Advanced Process Control (APC) & AI: An Improve phase technology that uses algorithms to run processes at their theoretical peak efficiency, minimizing energy and material use while maximizing yield.
- Digital Twins: A virtual model of a physical process used to Analyze inefficiencies and Improve by testing scenarios without disrupting live production.
The Role of Circular Economy Principles
Six Sigma Labs integrates Circular Economy thinking as a high-level Improve strategy:
- Waste as a Resource: A DMAIC project might analyze production scrap to find root causes of contamination, thereby improving its quality so it can be recycled directly back into the process instead of being downcycled or landfilled.
- Industrial Symbiosis: The Analyze phase may reveal a waste stream (e.g., waste heat, spent catalyst) that can become a raw material for a neighboring facility, turning a disposal cost into a revenue stream.
Conclusion: The Operational Bottom Line
The industrial application of the Environmental Footprint through the Six Sigma Labs lens is the ultimate form of lean manufacturing. It moves beyond eliminating waste in time and motion to eliminating waste in molecules and energy.
For industrial leaders, the results are unequivocal:
- Lower Variable Costs: Reduced bills for energy, water, and raw materials.
- Higher Asset Utilization: Processes run at their optimal efficiency, increasing throughput.
- Reduced Regulatory and Reputational Risk: Proactive management prevents fines and brand damage.
- Enhanced Innovation: The constraint of “doing more with less” drives technological and process advancements.
By treating the Environmental Footprint with the same rigor as production yield or financial performance, industrial companies do not just become greener—they become leaner, more resilient, and more profitable.